Introduction
rotterdam impressions with the 'annotation compass'
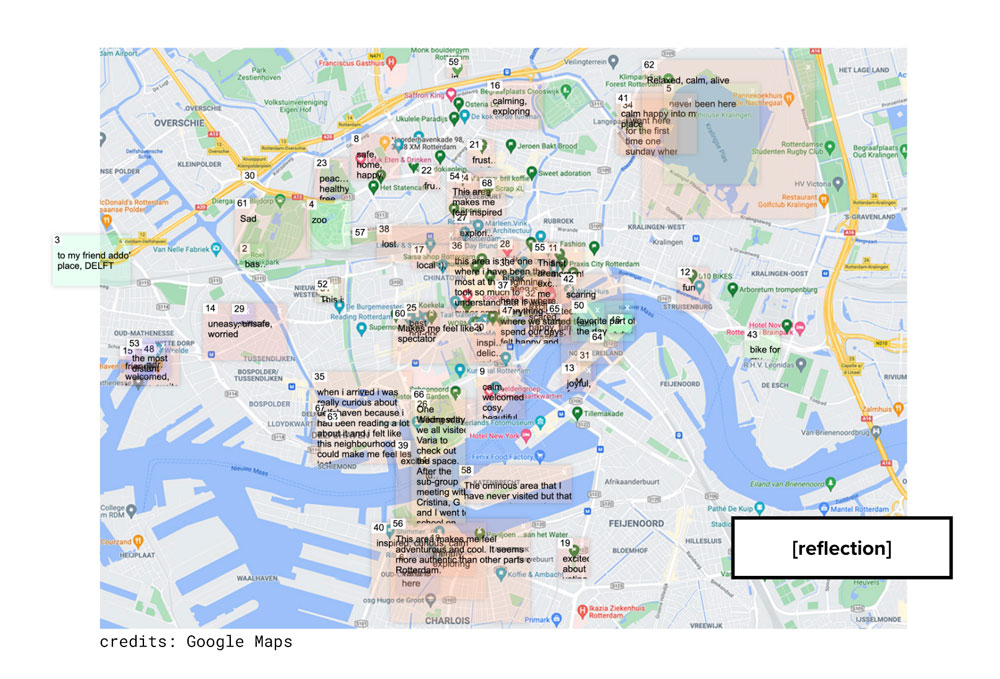
We all arrived here from different places, backgrounds, histories and languages. As a group, we are building our relationships and exploring our personalities. Brought to this new place, we discover it both individually and collectively. The city is our everyday environment - we navigate in it to go to school, to go home, to do our grocery, to have a drink out. We spend some of these moments alone, sometimes with someone else. In a short moment of reflection, we all remembered our first or strongest impressions of some particular areas of Rotterdam, which triggered a memorable emotion in us.
These illustrated subjective maps represent the impressions of the first year master students of Experimental Publishing at the Piet Zwart Institute. Their situated experiences trigger various ways to describe their new home: Rotterdam. They were invited to reflect on the way they remember some of the areas in the city and to describe how they feel about them. In words, in their own vernacular English - the common language that is not native to anyone of them but the main language they communicate between each other. Afterwards, their descriptions were filtered by a Python function to extract the most common words they used whilst describing their perceptions of the selected areas on the map, divided in three main categories - adjectives, nouns and pronouns. The final outcome is this short list of the most common impressions of various places and illustrated maps as an artistic expression of the author.
the most common...
In the following lists we observe the most common words the annotators used in their descriptions. They were asked to describe how they feel about areas and places they see on the map which trigger some memories and emotions in them. By using the Python filters for extracting the words that are adjectives (the words people used to describe their impressions of Rotterdam and various areas and places in it), nouns (the objects that we see people referring to) and pronouns (they way the approached the reflection) in combination with a filter for the most common words (which shows us which words are used the most and how many times), we can observe what are the feelings and impressions that they share as a new collective. What are the places and emotions that are common for some of them?
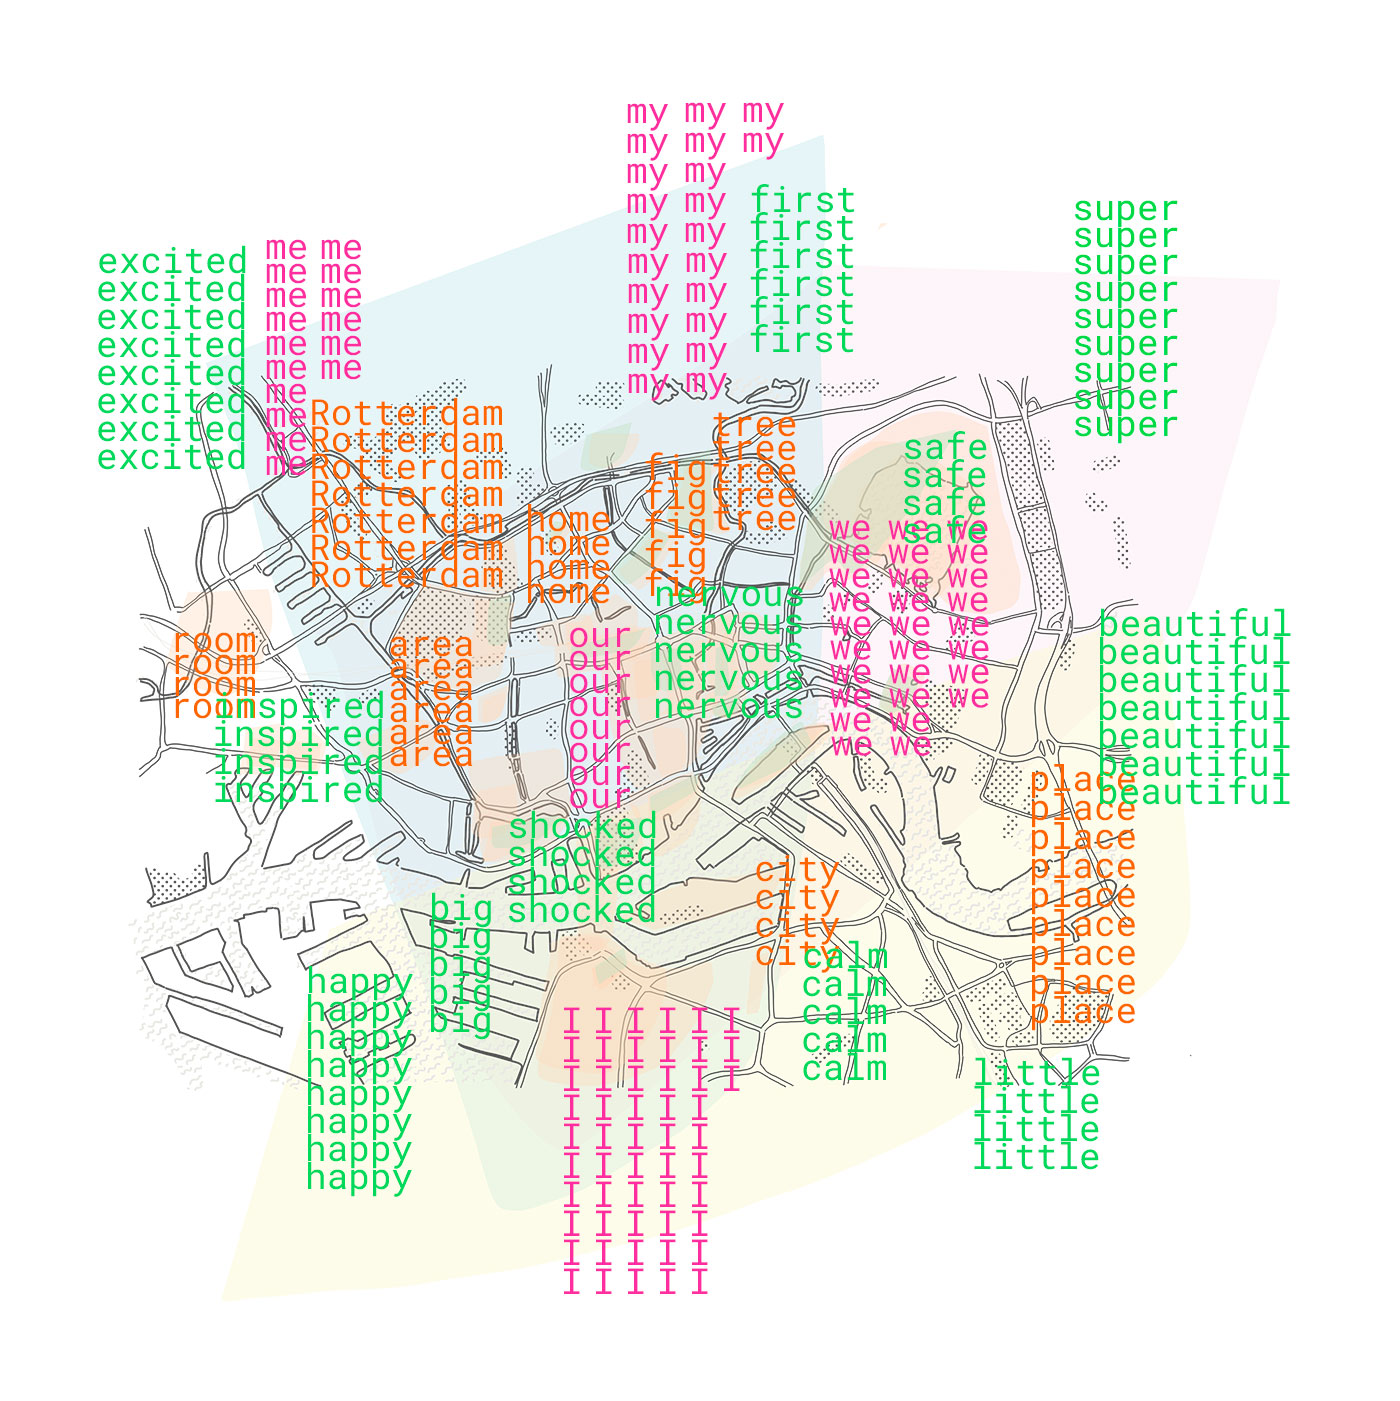
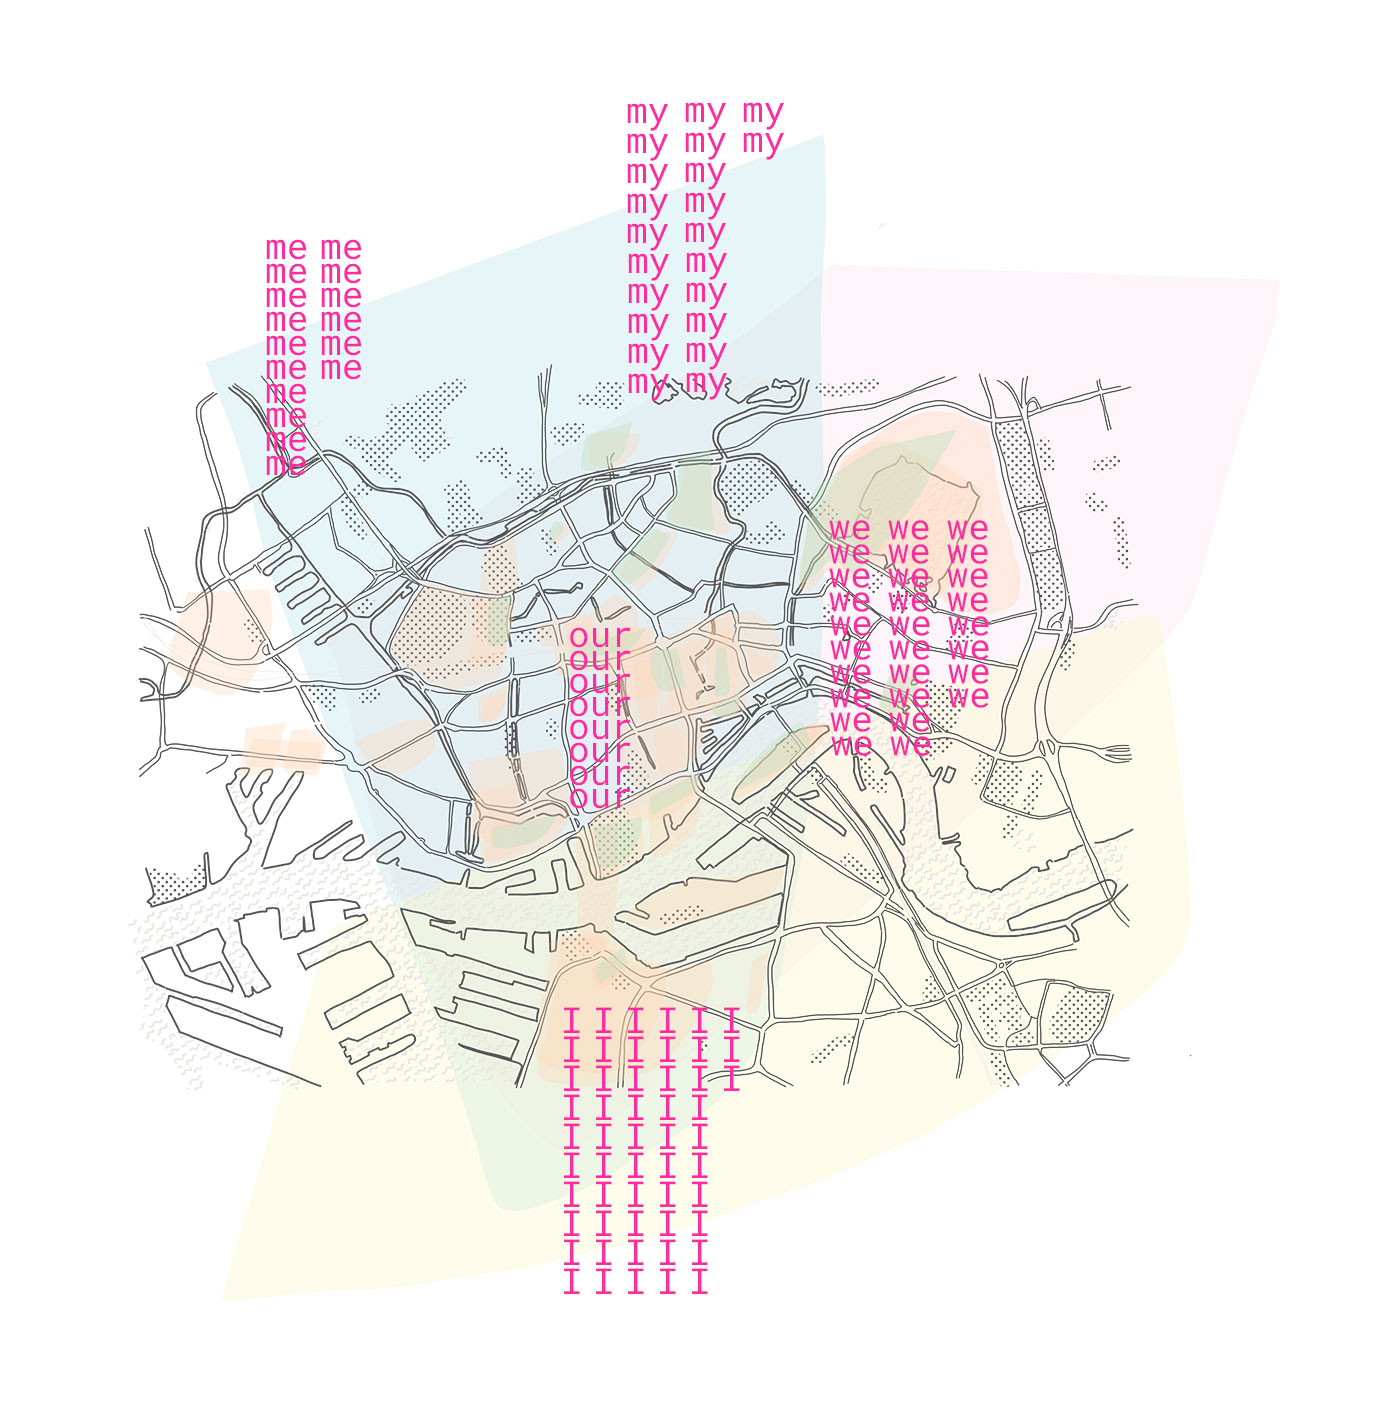
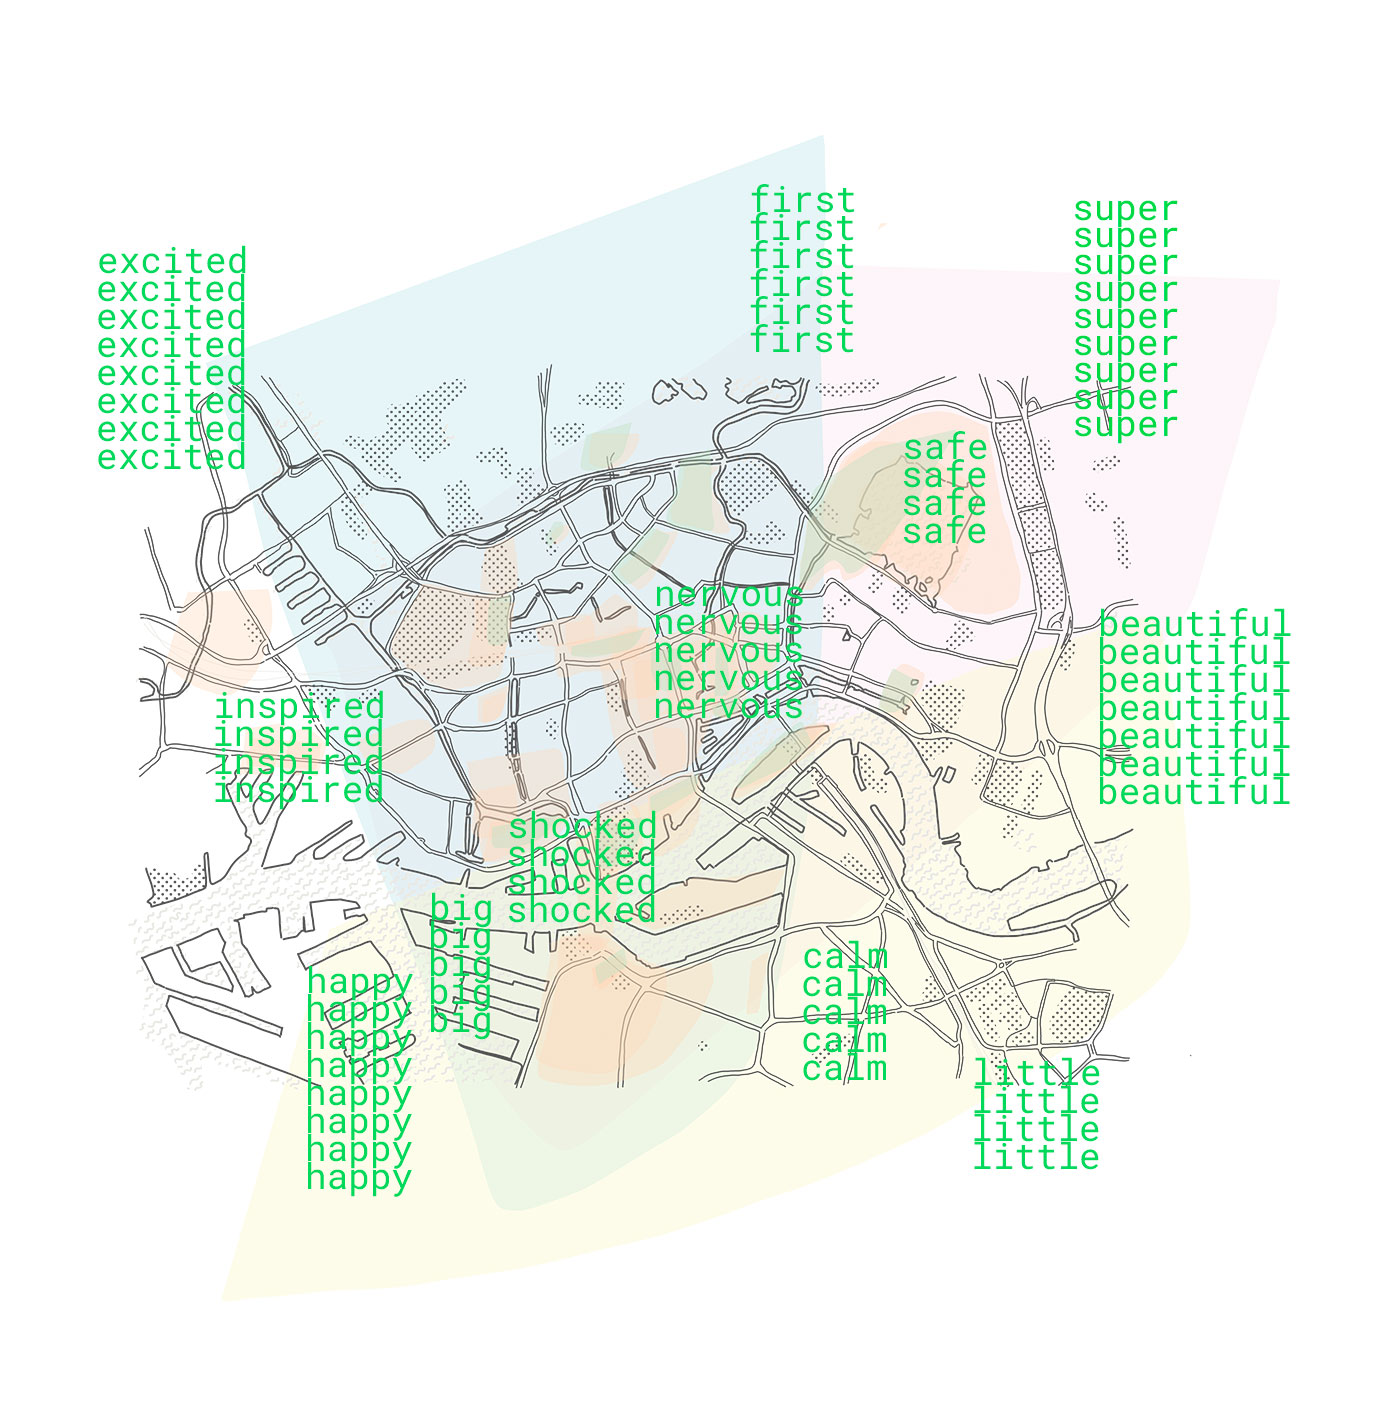
[('I', 53), ('my', 21), ('we', 19), ('me', 16), ('i', 13), ('place', 9), ('super', 9), ('We', 9), ('happy', 8), ('excited', 8), ('our', 8), ('were', 8), ('beautiful', 7), ('Rotterdam', 7), ('first', 6), ('area', 6), ('calm', 5), ('nervous', 5), ('big', 5), ('fig', 5), ('tree', 5), ('safe', 4), ('home', 4), ('inspired', 4), ('city', 4), ('little', 4), ('room', 4), ('shocked', 4), ('fun', 3), ('frustrated', 3), ('friendly', 3), ('good', 3), ('best', 3), ('bridge', 3), ('school', 3), ('nice', 3), ('station', 3), ('weird', 3), ('sad', 3), ('bike', 3), ('neighborhood', 3)]
vernacular map
The visual maps of [rotterdam impressions] depict how many times specific words were mentioned in the descriptions overall - the positions of the words are not related to the specific areas where they were mentioned because they are a collective print of how many times these words were used anywhere on the map. By printing each time a word was used, we can see the intensity of words used by the annotators. They are coloured due to their category - adjectives are in green, nouns are in orange and pronouns - in pink.

how are we describing
"I" and "we" are the most common pronouns (in pink) that were used in the annotations. You can see that "I" was used as twice more often that "we", but perhaps because of the context of us describing our first impressions of a new place where everyone arrived to study and work together as a group, some of the experiences were still connected to a collective moment.
adjectives as emotions and impressions; nouns as objects
In the context of the annotation compass, the adjectives (in green) were filtered and extracted as impressions and descriptions of the new place where people arrived. They are either describing Rotterdam and places inside it, or the way the annotator feels about them. Either way, in most of the cases we can still get the emotion that lays behind the word used. The most common nouns are understood as the objects (in orange) - the ones people are relating most often to.

Functions
To filter the adjectives from the annotations:
def adjectives(text):
    adj = []
    for (word, tag) in labels_blob.tags:
        if tag == 'JJ':
            adj = adj + [word]
    return adj
To filter the nouns from the annotations:
def nouns(text):
    noun = []
    for (word, tag) in labels_blob.tags:
        if tag == 'NN':
            noun = noun + [word]
    return noun
To filter the most common words from the annotations:
def most_common(words):
    freq_dist_pos = FreqDist(words)
    return freq_dist_pos.most_common(100)
Process
Getting to the final showcase of the "annotation compass" was a long way of going back and forth whilst learning my first steps in Python. From the beginning my idea was to create vernacular map of our rotterdam impressions using our words in describing emotions and experineces. Here is what happened on the road:
0. background story
In May 2021 I went through a massive burnout which resulted in me going to the hospital and not being able to climb the stairs at home normally for a week, because I couldn't take a deep breath. This traumatic experience got me started paying more attention to the signs of me getting overwhelmed; and also since then I have been living in fear of going through a similar experience again.
After that crazy time, I had to organise my moving to Rotterdam and do some work on the way around Europe. After a year in isolation because of the pandemic, this was a dramatic change and I was afraid I might have another panic attack whilst being alone in the train in the middle of nowhere. In order to keep a track of my emotions and the way I feel, I started mapping them. That experiment made me think more of how to use our "annotation compass" to map our group's experiences and feelings.
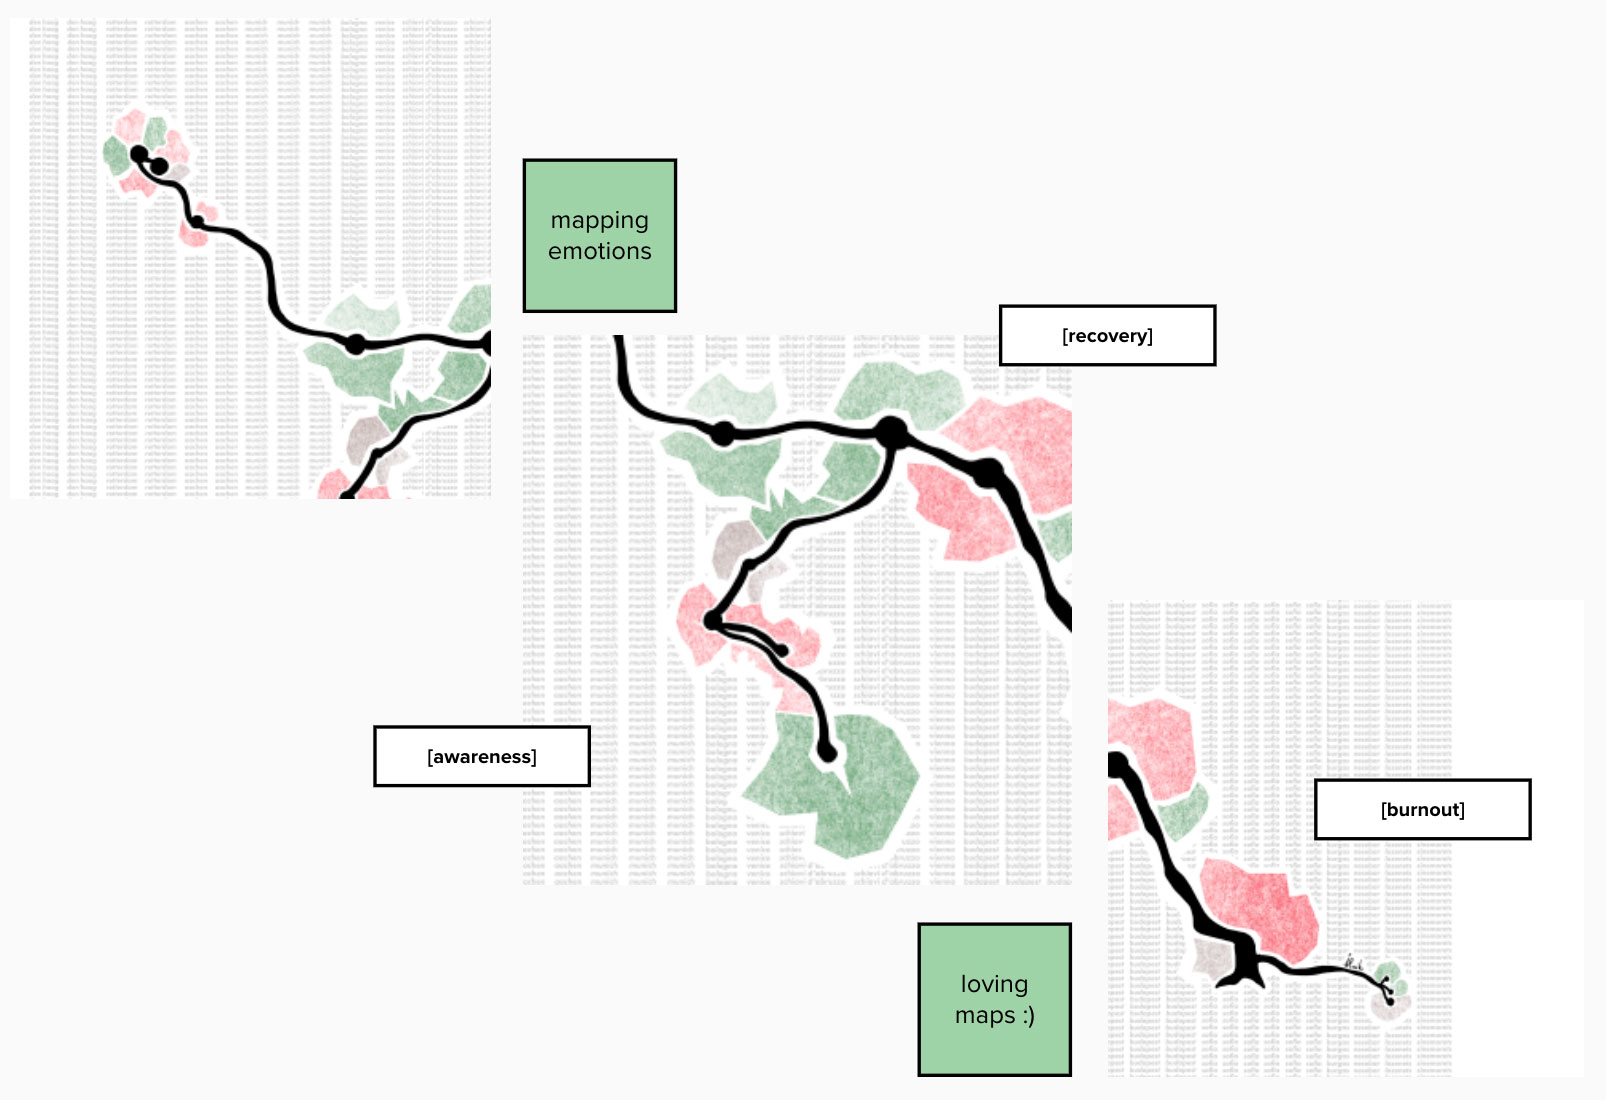
1. ideas & prototypes
The initial idea was to try mapping our emotions when reflecting on our first experiences in Rotterdam. In order to visualise that, I made a few prototypes by me mapping the places I feel most strongly about and then doing the same with my colleague Supisara.
The prototypes were adjectives put on the map of Rotterdam, describing how we felt about a specific place or area. Later on, I figured it would be much more interesting to give freedom to the annotator to choose how they want to describe their perceptions. And after that, I could filter their texts in order to extract the adjectives.

2. collecting annotations
We used the "annotation compass" to write down some reflections about our arrival in Rotterdam and the way we feel about some places and areas. The invitation to the group was to take a few minutes to reflect on their arrival in the city and they feel strongly on some areas and spaces; and to describe the way they feel about them.
3. filtering the annotations with python
Since there was no restriction what words the use in the descriptions, I applied a combination of Python functions in order to process the data and extract the most common words. I also looked up for how many times the most common adjectives, nouns and pronouns were used. Looking at the result of the text processing, I created illustrated maps with the number of times these most common words were used.